FBC are available in bubbling, circulating, and expanding bed (which is in between) types, depending on the in-bed gas velocity and mean particle size. Each of the systems is separately described after the following discussion on the fundamentals of fluidization technique.
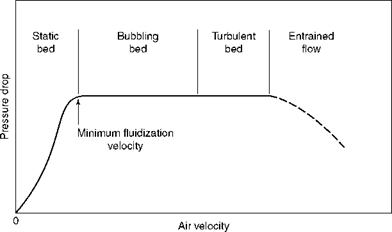
When gas is passed through a chamber with a bed of solids resting on the bottom plate with provision for a good air distribution, at first there is no apparent disturbance to the bed because the air flows between the solids. As the airflow is increased, the pressure drop
|
FIGURE 12.1 Effect of increasing air velocity in bed of solids. |
Across the bed increases proportionately. Then a point is reached when the bed is lifted off the plate, which is the onset of fluidization and the bed starts to behave like a free-flowing fluid from this point onward. The minimum fluidization velocity is depicted in Figure 12.1. At this point there is no appreciable movement of the particles with no mixing and turbulence, which will increase with increased gas flows.
With more gas flow, the bed expands more and becomes less uniform. Slowly thereafter the bubbles of gas start to form, with the attendant violent reaction. This is the bubbling fluidized bed (BFB). The process is similar to the bubbling in boiling water. Air pressure drop, meanwhile, remains constant.
With increase in gas, the bubbles get larger and coalesce to make large voids in the bed. The heavier particles start settling at the bottom and lighter particles swirl at the top. As the gas velocity is increased, the churning bubbling bed, with a dense bed at bottom and a light haze of dust at the top, yields to a cloud of dust filling the entire space. This is the turbulent phase. Even now the pressure drop remains the same.
In this turbulent phase, when the elutriated solids are captured and returned to the bed, a circulation of dust can be established.
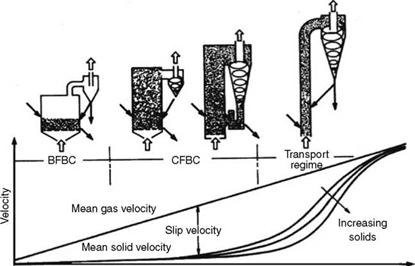
The difference in the mean velocities between the gas and the solids is the slip velocity. As shown in Figure 12.2, the slip velocity continuously increases in the bubbling and turbulent bed regimes. At the end of the turbulent period, the solids start attaining higher velocities and start leaving the bed, which is the beginning of the transport regime.
As the flow is increased, the dense cloud also rises to join the cloud above and this is called entrainment, marking the end of fluidization phase and the beginning of the transport phase. When the particles are not recirculated, the pressure drop, which remained practically constant during the entire fluidization, starts to reduce, as the solids get entrained and leave the chamber. The physical properties of fluid and bed material, such as viscosity, density, and particle size, decide the velocities at which fluidization and transport regimes set in. Figures 12.2 and 12.3 depict the various regimes with velocity ranges and particle sizes.
• The combustor changes progressively from short and broad in stoker firing to tall and narrow in PF, whereas the upper furnace gets increasingly dustier.
|
O Gas Solids
Increasing expansion FIGURE 12.2 Stages of fluidization. BFBC, bubbling fluidized bed combustion; CFBC, circulating fluidized bed combustion. (From AE&E Lentjes GmbH, Germany. With permission.) |
Fluidized bed firing
|
Stoker firing |
![]() Pulverized firing
Pulverized firing
Stationary bed Bubbling fluidized bed Circulating fluidized bed Entrained bed
![]()
|
Air Fuel |
![]() Gas
Gas
Gas
Gas
|
‘ j 1 |
■:oil:ent |
II |
1 |
|
Air Ash |
Air Ash |
Air Ash |
Ash |
|
Bed velocity (m/s) ~2.3 to 3.0 |
1.8-3.0 |
4.5-7.0 |
4.5-7.0 |
|
At full load (ft/s) ~ 8 to 10 |
4-10 |
15 -23 |
15 -23 |
|
Average bed |
0.5-1.5 |
.3 0. — 0. |
0.05 |
|
Fuel |
|
Fuel and sorbent |
|
Air Fuel and |
|
Particle size (mm) 6 FIGURE 12.3 All firing modes for solid fuels. |
With the increasing in-bed gas velocity, the pressure drops across the bed are constant in the entire fluidization range; however, the pressure actually drops in the transport regime.
Although the bed velocities increase, the average particle size steadily decreases. In fact, in current boiler design, there is no significant change in the bed velocities between the CFB and transport regimes. The difference in practice is that due to the smaller particle size they get entrained.
In FBC boilers operating at ~850°C, there is an inherent lower production of NOX automatically, as the combustion temperature is low. These boilers also offer a very convenient way of reducing the SOX within the furnace enclosure by the reaction with lime. This desulfurization is adopted only for coals and other solid fuels with medium to high sulfur. This point needs to be understood clearly, as there is a popular misconception that FBC and desulfurization go together. In fact, with low sulfur in coal or biofuels with greater reactive Ca in fuel ash, the FBC boilers are operated with no lime addition. This enables boiler operation at a 70-100°C higher bed temperature with coal, which will offer slightly higher combustion efficiency and a marginally more compact boiler.
In-bed desulfurization is a breakthrough. Lime-sulfur reaction within the furnace, along with the combustion reaction and the resultant gypsum exit with ash is simplification personified. A good understanding of the mechanics of this reaction and the limitations is very necessary for realistic emission guarantees and also to configure limestone and ash handling systems that meet the present and future requirements.
Calcination. CaO is produced by the decomposition of lime (CaCO3) when CO2 is driven off on heating. This process is called calcination of lime, and is an exothermic reaction.
Sulfation. Lime-sulfur reaction (sulfation) is basically turning the SO2 produced (from the oxidation of sulfur on combustion) to gypsum (CaSO4) by its reaction with CaO. This is an endothermic reaction.
CaCO3 + 425.5 kcal/kg (766Btu/lb) = CaO + CO2 on heating—Calcination reaction
S + O2 = SO2 — Combustion
SO2 + — jCaO + O2 = CaSO4 + 3740.5 kcal/kg(6733Btu/lb) — Sulfation reaction
Both sulfation and calcination reactions start at ~700°C (1300°F) and are optimum at 840-850°C (—1545 to 1565°F). The lime consumption is lowest at this temperature range. Even then the theoretical requirement of 1 mol of Ca per mol of S (Ca/S ratio of 1) cannot be reached because
• The sulfation takes place on the surface of the lime particle in the bed and so the core of the particle fails to participate.
• Some sulfur in fuel, which is inorganically bound, does not oxidize to SO2.
• Some SO2 escapes when sorbent is less or accompanies the volatile matter (VM) of fuel.
• Limestone purity is lower than optimum—typically —92%.
A bed temperature range of 800-900°C (1470-1650°F) is important for desulfurization because
• Calcination is not complete at temperatures <800°C.
• Sulfation reaction falls off rapidly beyond 850°C because CaSO4 formed on the surface of CaO melts due to high temperature and forms a coating on CaO, inhibiting further exposure to reaction.
• Within the residence time SO2 gas molecules do not encounter reactive solid CaO particles despite high bed turbulence.
|
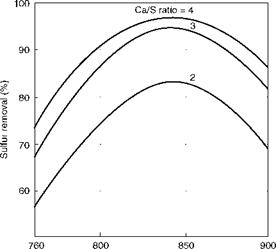
(1400) (1472) (1562) (1650) Bed temperature (°C/°F) FIGURE 12.4 Effect of bed temperature and Ca/S ratio on sulfur removal in bubbling fluidized bed combustion (theoretical). |
Limestone consumption increases outside of this range. Figure 12.4 shows the manner in which the sulfation reaction peaks out at ~850°C and how the limestone demand escalates for greater sulfur removal in BFBC. A practical limit for desulfurization in BFBC can be considered as 85% with a Ca to S ratio of 2.5 to 3.0. But with CFBC boilers having a longer residence time of ~5 s (2.5 s in BFBC) and smaller fuel and limestone particle size, this limit can be considered as 95% with Ca/S ratio of 1.8 to 2.5, depending on the sulfur content of the fuel and the purity and reactivity of limestone.
At higher levels of ash at >40% and sulfur at >5%, Ca/S ratios sharply escalate to meet the limits, and the process becomes uneconomical.
At elevated temperatures, oxygen combines with nitrogen to form nitrogen oxides and other complex compounds collectively called NOx. Nitrogen is present in fuel and combustion air. Nitrogen in fuel forms fuel NOx and in air forms thermal NOx.
See Sections 10.2.8 and 13.4.10 on low NOx burners.
For thermal NOx, much higher temperatures of >1200°C (2200°F) are needed, which are fortunately not feasible for FBC.
Fuel NOx is formed in FBC, and laboratory data indicate that almost all the fuel nitrogen may be converted to NOx. For 1% of N2 in the fuel, the potential NOx formation is —3800 mg/N m3. But that is largely reduced to elemental nitrogen again by the presence of the
Strong reducing agents in the form of char (C) and CO in the bed. Furthermore, in CFBC,
Because of staged combustion, substoichiometric conditions prevail in the bed, increasing active C and CO. The resulting NOx is nearly half of that formed in BFBC boilers. Typical NOx values at 6% O2 are
• BFBC: <400 mg/N m3 or <200 ppm
• CFBC: <200 mg/N m3 or <100 ppm
|
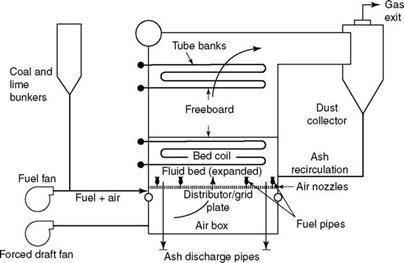
FIGURE 12.5 Underbed feed-type bubbling fluidized bed combustion boiler. |
The values are much lower than in PF firing, which is mainly due to thermal NOX <2000 mg/N m3 with normal NOX burners and 600 mg/N m3 with low NOX burners due to lower flame temperature and air staging.
The deSOX and the deNOX efforts work in opposite ways. Higher Ca/S ratio, that is, greater lime dosing is known to increase NOX levels.
Figure 12.5 captures the effect of combustor temperature on NOX generation. Between 850 and 950°C, the NOX increases more than three times. One part per million of NOX on a dry volume basis = 2.05 mg/N m3.


 8 сентября, 2013
  admin
admin 


 Опубликовано в рубрике