Gas turbines derive their name from their working medium. They are also called combustion turbines. Gas turbines first made their appearance in the late 1940s as revolutionary self-contained power plants. They were initially used for peaking duties because of their quick starting capabilities and small sizes. Smaller GTs are also widely used as mechanical drives for big compressors and pumps.
Gas turbines quickly reached a leading position in the field of power generation due to increased NG availability and
• Rapid customization of the jet engine for land operations
• Improvements in reliability
• Increases in size
• Progressive reduction of costs
• Efficiencies based on better compression ratios and firing temperatures.
The improvements in GTs were matched by improvements in HRSGs and steam turbines (STs) to enable building larger and more efficient power plants. The manufacturers of the GT, ST, and HRSG worked closely to achieve cost reductions and efficiency improvements to challenge coal. The net result is that
• Standardization and modularization reduced the time for power plant construction.
• Simplified plant layouts and standardized configurations reduced the installed costs of the power plants.
• Improved cycle efficiencies in CC operation substantially mitigated the burden of higher fuel costs.
Since the 1980s, there has been a dramatic growth in the sizes of GT and its popularity. Heat recovery steam generators have also grown both in size and complexity. In the latter part of the 1990s, with natural gas (NG) availability increasing and its cost stabilizing at a lower level, the clamor for gas reached unprecedented levels. Old coal-based plants were dismantled to make way for gas plants based on sound economic sense.
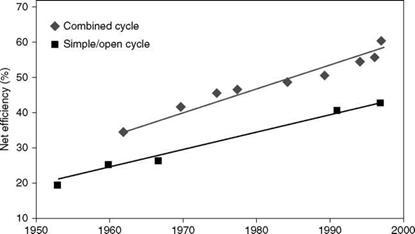
Figures 14.1 and 14.2 capture the progress of GTs in terms of OC or SC and CC efficiencies and firing temperatures.
|
Year FIGURE 14.1 Progress of the efficiency of gas turbines. |
|
Year FIGURE 14.2 Progress of cycle efficiencies. |
• The practice in the industry is to report GT performance for base load operation at 15°C (59°F) sea-level site conditions on NG.
• Power output is the gross plant output for OCs and net plant output for CC plants. Net output accounts for
— Parasitic auxiliary plant loads
— Losses in gear box
— Intake losses
— Outlet losses
• Heat rate is the fuel heat input on net calorific value (NCV) basis for unit power output expressed in kilojoules per kilowatt hour (kJ/kWh), kilocalories per kilowatt hour (kcal/kWh), or British thermal units per kilowatt hour (Btu/kWh). In GTs, the NCV is used traditionally for heat rates. In conventional power plants both GCV and NCV are used. Power and heat rate are measured across the generator terminals for power plants.
• Efficiency is the ratio of power output to heat input expressed as a percentage. For OC, the power output is the gross power, whereas for CC, it is the net power.
• Compression ratio or pressure ratio is the ratio of the discharge pressure of the GT compressor to the atmospheric pressure of air at the GT intake.
• Flow is the airflow through the GT expressed in tons per hour (tph), kilograms per second (kg/s), or pounds per second (lb/s).
• Turbine speed is the design speed of the output shaft. The speeds for power generation are 3000 and 3600 rpm at 50 and 60 Hz, respectively.
• Exhaust temperature is the gas temperature at the outlet of the turbine exhaust duct.
Gas Turbine versus Steam Turbine
Although GT and ST are rotating machines sharing many mechanical design features, the GT is a power plant whereas the ST is a prime mover. The two can be compared in the following manner:
• Just as the ST expands the high-pressure (HP) and high-temperature steam from higher to lower levels of pressure to produce electrical energy, GT expands HP and high-temperature gases to do the same.
• The input to ST is ultraclean steam at temperatures <620°C, whereas GT input consists of clean or slightly fouling gases at very high temperatures of up to 1450°C.
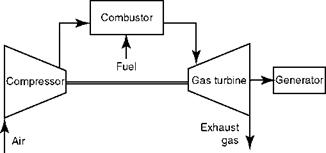
• A GT is a complete power plant because it has a
— Compressor to produce HP air
— Combustor to burn the fuel, raise the temperature, and infuse the gas with heat energy
— Turbine to expand the hot gases and generate mechanical power from heat
— Generator to produce electrical power from mechanical energy
• The entire GT power plant is attractively skid-mounted.
A very important practical difference is that the STs are custom built and GTs are available in standard sizes. GTs are manufactured and sold, whereas STs are sold and then manufactured. The lead times for procurement are thus significantly lower for GTs.
1. Air compressor for compressing air to a high pressure. The compressors can be either centrifugal or axial, with the latter more popular in larger sizes. In axial-flow compressors, the air enters at the periphery of the rotor where the blades are fixed, unlike in centrifugals where the entry is in the center. The air moves alternately in the stationary and the moving blades, shaped like diffuser and aerofoil, for change of direction and acceleration, respectively. The compressor blades are precisely shaped to achieve efficiencies of —90%.
2. Combustor to burn the fuel in an efficient manner. Proper mixing, dilution, and cooling are performed so that the hot spots are minimized and gases leave at a fairly uniform temperature. Fuel is mostly NG, although other fuels can also be burnt. The lengths of the combustor are designed to provide adequate time and space to burn the fuel completely. Of late, NOx generation has received a lot of attention, and the emission levels have reduced from —70 to 10 ppmv in many newer GTs.
3. Steam turbine to generate power to run the compressor and drive the generator or provide hot exhaust or both. The combustion gases expand in the GT nozzles and blades in the same way as steam expands in the ST. A portion of the heat is converted into kinetic energy in the nozzles, and another portion is transferred to the rotating blades for conversion. The nozzles and blades along with the carrying disk are exposed to very high gas temperatures of 1200°C or more. Together with the contaminants in air and fuel, these parts experience accelerated oxidation and hot corrosion. Since the contaminants are costly to remove and impossible to prevent, the only course is to resort to high-grade alloys and coatings to resist corrosion and extend the life of hot parts.
The compressor in the GT consumes about two-thirds of the generated power. The following systems make the GT complete.
1. Inlet air cleaning system
2. Fuel oil or gas conditioning system
3. Lubricating system
4. Start-up system
5. Control system
Gas turbines can have single, double, and triple shafts.
1. Single-shaft turbines, popular with drive applications, have a single common shaft with all the stages operating at the same speed. This is depicted in Figure 14.3.
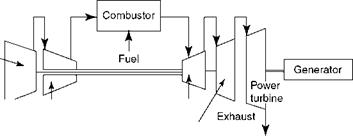
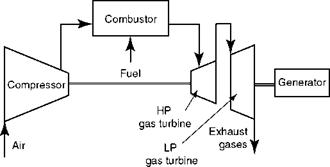
2. In a double-shaft arrangement, the HP part of the GT is mounted on a separate shaft and connected to the compressor, whereas the other part is rigidly connected to the load and called the power turbine (Figure 14.4).
3.
|
FIGURE 14.3 Single-shaft gas turbine in simple cycle. |
![]() In a triple-shaft arrangement, there is a further division as shown in Figure 14.5. The compressor is divided into two parts with independent drive shafts.
In a triple-shaft arrangement, there is a further division as shown in Figure 14.5. The compressor is divided into two parts with independent drive shafts.
|
|
|
FIGURE 14.4 Double-shaft gas turbines in simple cycle. |
High-pressure gas turbine,
|
Low-pressure Compressor |
![]()
|
High-pressure Compressor |
![]()
 Low-pressure gases
Gas turbine
FIGURE 14.5
Triple-shaft gas turbines in simple cycle.
The efficiency of GT increases in proportion to the
• Air compression ratio
• Firing temperature
Consistent with physical limits. Beyond a certain optimum compression ratio, the compressor power requirement increases significantly, and there is no more increase in the power output, and there is, in fact, a drop in efficiency. In case of firing temperature, the metallurgical limitations act as constraints.
The usual compression ratios in land turbines are between 10 and 20. In the recent Ahlstrom GT 24 and 26, higher ratios of 32-34 are used. The aeroderivatives always adopted higher ratios, from 16 to as high as 40.
Gas turbines are mainly employed in the following three ways:
1. Simple/open cycle
2. Cogeneration (cogen) cycle
3. Combined cycle
This mode is employed when the GT is operating on its own, as shown in Figures 14.3 through 14.5. With no heat recovery, the GT exhaust gases carry away between 35 and 40% of fuel heat. The main parameters vary between limits, as shown in Table 14.2.
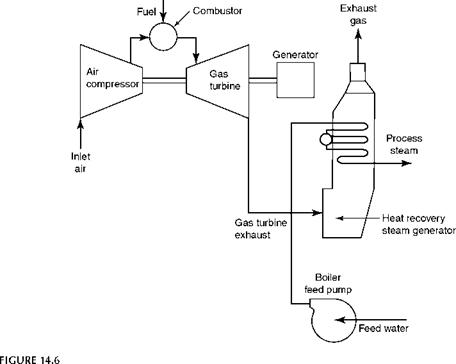
Cogeneration is the production of two usable forms of energy—usually power and steam. The exhaust gases from the GT are cooled in a HRSG to produce steam for process or power. As the steam requirements are not always in line with power generation, it is normal to have supplementary oil or gas firing in the inlet duct of the HRSGs usually to the extent of 100%, so that the plant is never short of power or steam. The efficiency of the cogen cycle with two or three pressure levels in the HRSG can easily exceed 80% as
|
TABLE 14.2 Main Operating Variables of Gas Turbines
|
|
Cogeneration. |
Opposed to 50-55% (maximum 60%) in the CC. Condenser loss present in the steam cycle does not occur in the cogen cycle (Figure 14.6).
In the CC, power is produced from both GT and ST cycles; the HRSG that converts the exhaust gas heat of the GT produces the steam for the ST. It is the Brayton/GT cycle riding over the Rankine/steam cycle to maximize both the output and the efficiency. With HRSG extracting nearly 90% of heat and converting it into power in the ST, the efficiency of the CC works out to be more than 50%. In the largest GTs, the efficiencies almost exceed 60% on NCV with the reheat cycle. The differences between the conventional steam cycle and the steam part of the CC are as follows:
• There are no extractions from the ST.
• There are no HP and low-pressure (LP) heaters.
|
Turbine LP |
|
Gas |
|
Air |
|
Compressor |
|
|
|
|
|
|
|
|
|
|
|
|
|
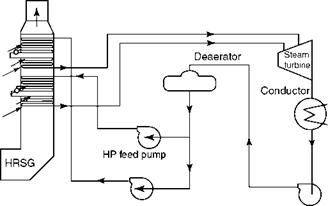
• There are steam injections into the turbine in the form of intermediate pressure (IP) and LP flows from the HRSG.
• Deaerator steam comes from the HRSG and not from the turbine bleed (Figure 14.7).
The gas turbine was originally developed in the aerospace industry. These turbines, with some minor modifications to suit land operations, have been applied to power generation since the early 1960s and are called aeroderivatives. These turbines are
• Made of much lighter aircraft materials
• More efficient, as the firing temperatures and compression ratios are higher
• Able to run at higher speeds
• Somewhat delicate
• More expensive
For SCs/OCs, aeroderivatives are better suited. They extract more heat from hot gases and exhaust them with lower total temperature and heat. Consequently, the HRSG behind an aeroderivative produces less steam and is smaller. Aeroderivatives are better where power is to be maximized over steam.
Industrial or Land Turbines or Frame Machines
Industrial or land turbines or frame machines are built primarily for power and cogen applications.
• They are heavier and ruggedly built.
• They can burn gas, No. 2 fuel oil, and heavier oils such as kerosene, diesel, and crude.
• Although the aeroderivative range stops at —100 MWe, the land turbines can reach -340 MWe.
|
TABLE 14.3 Comparison of Industrial and Aeroderivative Turbines
|
Frame Machine or Aeroderivative
• For power up to 100 MWe and cogen applications, both types can be considered, depending on the relative economics.
• For more than 100 MWe, only the land turbines are suitable.
• Aeroderivatives, despite their higher cost, are the only choices when weight or efficiency is the consideration, such as for barge-mounted power or OC plants. Table 14.3 compares both types of turbines.
The last two decades led to great growth and consolidation in the GT business. A list of
Leading companies and their range of GTs is provided in the following text.
• The capacities indicated here may not include the latest developments.
• Only the leading companies are listed here.
The annual issue of the Gas Turbine World lists all the makes and models.
USA
• General Electric (GE) is the leader, making both aeroderivative and land turbines from small (15 MWe) to very large (—340 MWe) capacities.
• Westinghouse of the United States is now a subsidiary of Siemens.
• Pratt and Whitney (P&W) makes only aeroderivatives up to —58 MWe.
• Solar Turbines makes several models of small GTs ranging from 1.2 to 15 MWe.
Europe
• Ahlstrom of France makes only land turbines from 56 to —290 MWe.
• Siemens of Germany makes only land turbines from —100 to —340 MWe.
• Rolls Royce (RR) of United Kingdom makes only aeroderivatives up to —58 MWe.
• Ansaldo Energia of Italy makes three models of land turbines of Siemens design of 77,166 and 280 MWe.
• Zorya-Mashproekt of Ukraine makes land turbines from 3 to 27 MWe.
Japan
• Mitsubishi Heavy Industries (MHI) makes only land turbines from —100 to —330 MWe.
• Hitachi Heavy Industries (HHI) makes land turbines in sizes of 15 and 27.5 MWe of their own design. Hitach is also the licensee of GE for sizes up to 243 MWe.
• Toshiba makes only land turbines of GE design from —76 to 255 MWe.
• Ishikawajima-Harima Heavy Industries (IHI) makes only aeroderivatives of GE deign up to 45 MWe.
India
• BHEL makes land turbines of both GE and Siemens designs from 26 to 280 MWe.
There are licensees in a number of countries making turbines conforming to the standards of Ahlstrom, GE, and Siemens. The licensees may not be able to offer the latest product developments of the licensor.
Customers choose GTs from the limited range of offered models, and characteristics are well known among the users. Although there is not much customization possible in the main machine, customization is usually restricted to the auxiliary plant.
There are a large number of GT models covering a range from <1 to —340 MWe. The lower range up to 20 MWe is usually for big drives in oil and gas industries and in ships. For gas — based power generation up to 20 MWe, a battery of gas engines is usually an economical choice. Tables 14.4 and 14.5 list the turbines that are in use in CC plants and hence are of relevance to the HRSG.
• The tables show ISO ratings (at 15°C, 60% relative humidity, MSL).
• The data apply to gas firing without steam and water injection that are usually adopted for performance enhancement.
• The heat rate is based on the NCV.
• An inlet and outlet gas pressure loss of 100 mm wg is considered.
The models listed in Table 14.5 are for 50 Hz. The latest figures may be at a slight variance. The table does not reflect the new designations of the Siemens turbines.
The high compression ratios and low exhaust temperatures of the aeroderivatives that are not matched in the frame machines are worth noting.
|
Make/Model |
Power (MW) |
Gas Turbine Efficiency (%) |
Heat Rate kcal/kWh) |
Compression Ratio |
Exhaust Gas |
|
|
Flow (tph) |
Temperature (°C) |
|||||
|
General Electric |
||||||
|
LM2500 PE |
22.35 |
35.37 |
2431 |
19.1 |
252 |
538 |
|
LM2500 + 6stg |
29.24 |
35.37 |
2431 |
22.6 |
316 |
519 |
|
LM6000 |
42.89 |
41.68 |
2G63 |
29.2 |
463 |
435 |
|
LM6000 PC |
5G. G4 |
40.26 |
2136 |
31.5 |
493 |
434 |
|
LMS100 PA |
98.95 |
45.4 |
1894 |
4G. G |
736 |
416 |
|
Rolls Royce |
||||||
|
RB211-6761 |
32.12 |
39.23 |
2192 |
21.5 |
34G |
503 |
|
Trent-50 |
51.68 |
41.85 |
2G55 |
34.G |
558 |
440 |
|
Pratt and Whitney |
||||||
|
FT8 PWR pack |
27.97 |
38.27 |
2247 |
2G.2 |
316 |
478 |
|
TABLE 14.5 Typical Frame Machines (50Hz) |
||||||
|
Gas Turbine Efficiency (%) |
Exhaust Gas |
|||||
|
Make/Model |
Power (MW) |
Heat Rate (kcal/kWh) |
Compression Ratio |
Flow (tph) |
Temperature (°C) |
|
|
Ahlstrom Gas Turbines |
||||||
|
8C2 |
56.3 |
32.G |
2686 |
17.6 |
71G |
5G8 |
|
11NM |
87.9 |
33.9 |
2536 |
12.5 |
1137 |
5G2 |
|
11N2 |
115.4 |
33.55 |
2563 |
15.5 |
144G |
531 |
|
13E2 |
172.2 |
36.19 |
2376 |
15.4 |
1937 |
537 |
|
26 |
28G.9 |
38.22 |
225G |
32.G |
2279 |
615 |
|
General Electric: PG |
||||||
|
5371PA |
26.3 |
28.41 |
3G27 |
1G.5 |
442 |
488 |
|
6591C |
42.3 |
36.27 |
2371 |
19.G |
422 |
574 |
|
6111FA |
75.9 |
34.88 |
2465 |
15.6 |
757 |
6G5 |
|
9171E |
126.1 |
33.72 |
255G |
12.6 |
1456 |
539 |
|
9351FA |
255.6 |
36.83 |
2335 |
15.4 |
2326 |
61G |
|
9371FB |
229.2 |
37.9G |
18.3 |
2362 |
63G |
|
|
Siemens: V |
||||||
|
64.3A |
67.7 |
35.G |
2457 |
15.8 |
69G |
582 |
|
94.2 |
163.3 |
35.35 |
2433 |
11.8 |
19G1 |
542 |
|
94.2A |
188.2 |
37.75 |
2278 |
13.4 |
1871 |
581 |
|
94.3A |
272.4 |
38.95 |
22G8 |
17.2 |
242G |
582 |
|
Mitsubishi: M |
||||||
|
7G1 |
144.1 |
34.72 |
2477 |
14.G |
159G |
542 |
|
7G1F |
27G.3 |
38.15 |
2254 |
16.G |
2347 |
586 |
|
7G1G |
334 |
39.47 |
2179 |
21.G |
2658 |
587 |
Gas turbines are, like fans and compressors, volumetric machines. Therefore, the following conditions have major impact on output and performance:
• Ambient conditions such as temperature, humidity, and altitude
• Inlet and exhaust chamber losses
• Water and steam injection
• Nominal rating of the GT, also known as the ISO rating, is the output at 15°C (60°F) ambient temperature, 60% relative humidity at MSL, or 760 mmHg absolute.
• Actual rating is obtained by making appropriate corrections to the nominal conditions.
• Base rating is the maximum continuous rating that can be maintained for at least 6000 h in a year.
• Peak rating is the maximum rating that can be maintained for a maximum of 200 h in a year.
It is important to note that unlike a conventional power plant, GTs are rarely run at their peak rating, as the effect of high gas temperature on hot parts shortens useful life. Peak duty is normally met by supplementary firing of HRSGs.
The effect of ambient conditions is so pronounced that the same turbine can give dramatically higher outputs in winter as compared with its summer output (Table 14.6).
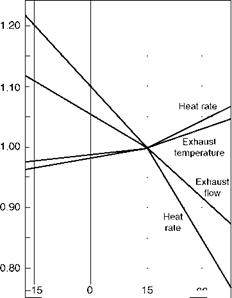
1. Ambient temperature. As the inlet temperature increases, the air weight (for the same volume) reduces and the power drops. Exhaust-gas temperature increases and the efficiency reduces, that is, the heat rate increases. The reverse reaction happens as the ambient temperature drops. Between 0 and 40°C, the rated output of a nominal/ISO 100 MWe GT can vary from 110 MWe to as low as 75 MWe. Typically for each degree Celsius increase in ambient temperature, the output drops by as much as 0.5-0.9% (Figure 14.8).
2. Altitude. At higher altitude, the air volume increases and correspondingly the weight of the airflow decreases, resulting in lowered power output. For every 300 m increase in height, the output suffers between 3 and 5%.
|
TABLE 14.6 Effects of Variation in Ambient Conditions on Performance of Gas Turbines
|
|
____ I___ ___ I_______ ________ i 30________ (0) (20) (40) (60) (80) (100) Air inlet temperature (°C/°F) FIGURE 14.8 Correction curve for ambient temperature. |
3.
|
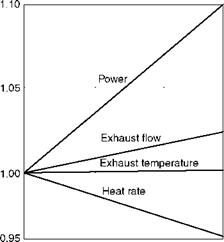
Specific humidity (kg/kg) 0.00 0.01 0.02 0.03 Site elevation (m) FIGURE 14.9 Correction curve for site elevation and humidity. |
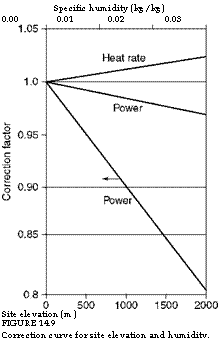 Humidity. The effect of humidity is marginal. Water vapor lightens the weight of the air-water combination, resulting in diminished power.
Figure 14.9 captures the effects of altitude and humidity on power and heat rate.
Effect of Inlet Pressure Losses
The inlet pressure adds to the load on the compressor, and an increase in inlet pressure loss reduces the output. Inlet losses arise from the
1. Inlet air filter
2. Silencer
3. Evaporative cooler (if provided)
4. Inlet air ducts
The increase is mainly because of the dust that builds up in the inlet filter over time. Inlet loss is usually between 75 and 100 mm wg. A 25 mm wg increase in the inlet loss reduces the power output by —0.5% and increases the heat rate by —0.1%.
Effect of Exhaust Pressure Losses
The exhaust pressure loss or back pressure is usually —100 to 125 mm wg in OC as the gas exhausts through the outlet duct, silencer, and bypass duct. In the CC, there is additionally the resistance offered by the HRSG with its inlet duct and stack, which totals 250-430 mm wg. The loss across the HRSG is between 200 and 300 mm. A 25 mm wg increase in the outlet loss reduces the output by 0.15% and increases the heat rate by 0.1% (Figure 14.10).
|
|
|
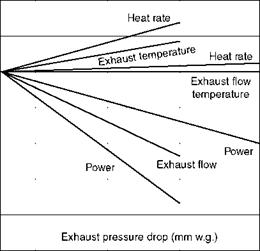
FIGURE 14.10
Corrections for outlet and exhaust pressures.
There are several ways in which the GT performance is enhanced. A proper understanding of these techniques is necessary, as they have a direct relation to the HRSG design. A few popular methods are discussed here.
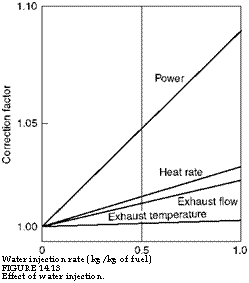
When steam or water is injected into the combustion chamber of the GT prior to combustion, the
• Gas turbine output is increased
• Fuel NOx generation is lowered
The enhanced gas flow increases the power output from the turbine without raising the compressor input. With water injection the heat rate increases, whereas with steam injection the heat rate reduces because the steam adds to the heat, whereas water takes away the heat for its evaporation.
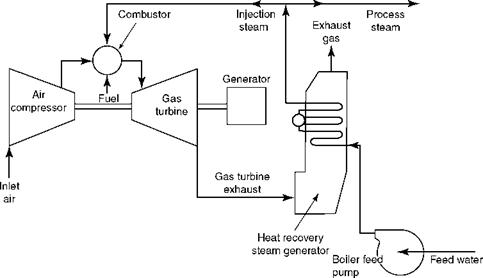
Steam for injection is drawn from the HRSG. This is known as steam-injected gas turbine (STIG) cycle or Cheng cycle. There is no other equipment involved in this cycle. This is popular in the cogen arrangement in which the desired power can be produced during low steam demand or for peaking. When more steam or water is added beyond what is required for NOx control, the system is in power boost mode.
Steam injection is done up to 2 kg/kg of fuel. Aeroderivatives are more useful for power augmentation by steam injection (Figures 14.11 through 14.13).
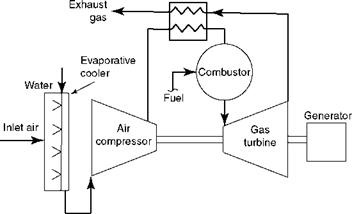
In hot and dry places, it is possible to cool and humidify the inlet air to the extent of 90% difference between the dry and the wet bulb temperatures. Lowered temperature and
|
FIGURE 14.11 Steam-injected gas turbine cycle. |
|
|
|
O O |
|
0 0.5 1.0 1.5 Steam injection rate (kg/kg of fuel) |
|
FIGURE 14.12 Effect of steam injection. |
|
Water injection rate (kg/kg of fuel) FIGURE 14.13 Effect of water injection. |
 Enhanced humidity increase the weight of entering air, which in turn, increases the power output. The water quality must be high, as any contamination affects the performance of the GT.
Regenerative or Recuperative Cooling
To improve the efficiency of the OC, the exhaust gases are cooled by the combustion air in a counterflow heat exchanger (HX), thereby transferring part of the heat to the air entering
|
FIGURE 14.14 Evaporative and recuperative cooling cycles. |
The combustion chamber. Between 20 and 25% of the exhaust heat can be recovered this way. Figure 14.14 portrays the regenerative cooling arrangement as well as the evaporative cooling.


 14 сентября, 2013
  admin
admin 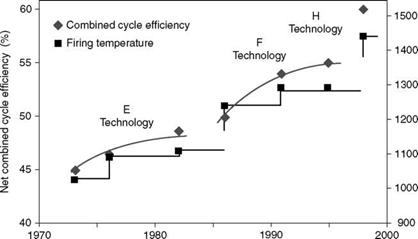
 Опубликовано в рубрике