9.01 Determining steam rates in steam turbines; actual and theoretical steam rates; determining steam quantity required to generate electricity; calculating enthalpy of steam after isentropic and actual expansion
9.02a Cogeneration and its advantages
9.02b Comparison of energy utilization between a cogeneration plant and a power plant
9.3 Which is the better location for tapping deaeration steam, boiler or turbine?
9.4 Determining fan power requirements and cost of operation; calculating BHP (brake horsepower) of fans; actual horsepower consumed if motor efficiency is known; annual cost of operation of fan
9.5 Effect of elevation and air density on fan performance
9.06a Density of air and selection of fan capacity
9.06b How fan horsepower varies with density for forced draft fans
9.7 Determining power requirements of pumps
9.8 Electric and steam turbine drives for pumps; annual cost of operation using steam turbine drive; annual cost of operation with motor
9.09a How specific gravity of liquid affects pump performance; BHP required at different temperatures
9.09b How water temperature affects boiler feed pump power requirements
9.10 Effect of speed on pump performance; effect of change in supply frequency
9.11 Effect of viscosity on pump flow, head, and efficiency
9.12 Determining temperature rise of liquids through pumps
9.13 Estimating minimum recirculation flow through pumps
9.14 Net positive suction head (NPSH) and its determination
9.15 Effect of pump suction conditions on NPSHa (available NPSH)
9.16 Estimating NPSHr (required NPSH) for centrifugal pumps
9.17 Determining NPSHfl for reciprocating pumps
9.18 Checking performance of pumps from motor readings; relating motor current consumption to pump flow and head; analyzing for pump problems
9.19 Checking performance of fan from motor data; relating motor current consumption to fan flow and head
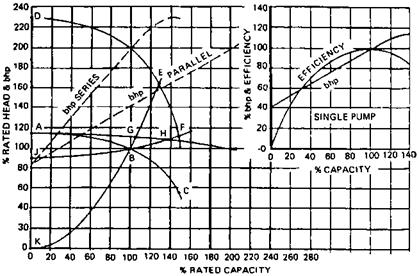
9.20 Evaluating performance of pumps in series and in parallel
9.21 Parameters affecting Brayton cycle efficiency
9.22 How to improve the efficiency of the Brayton cycle
9.01 Q:
How is the steam rate for steam turbines determined?
The actual steam rate (ASR) for a turbine is given by the equation
ASR = —3413 ^ a)
Zt X (h1 — h2s)
Where ASR is the actual steam rate in lb/kWh. This is the steam flow in lb/h required to generate 1 kW of electricity. hj is the steam enthalpy at the inlet to the turbine, Btu/lb, and h2s is the steam enthalpy at turbine exhaust pressure if the expansion is assumed to be isentropic, Btu/lb. That is, the entropy is the same at inlet condition and at exit. Given hj, h2s can be obtained either from the Mollier chart or by calculation using steam table data (see the Appendix). zt is the efficiency of the turbine, expressed as a fraction. Typically, zt ranges from 0.65 to 0.80. t
Another way to estimate ASR is to use published data on turbine theoretical steam rates (TSRs) (see Table 9.1).
3413
TSR = h—JT (2)
H1 — h2s
TSR divided by zt gives ASR. The following example shows how the steam rate can be used to find required steam flow.
|
Exhaust Pressure |
Inlet |
||||||
|
150 psig 366°F saturated |
200 psig 388° F saturated |
200 psig 500° F 94° F superheat |
400 psig 750° F 302° F superheat |
600 psig 750° F 261 °F superheat |
600 psig 825° F 336°F superheat |
850 psig, 825° F, 298° F, superheat |
|
|
2in. Hg |
10.52 |
10.01 |
9.07 |
7.37 |
7.09 |
6.77 |
6.58 |
|
4in. Hg |
11.76 |
11.12 |
10.00 |
7.99 |
7.65 |
7.28 |
7.06 |
|
0psig |
19.37 |
17.51 |
15.16 |
11.20 |
10.40 |
9.82 |
9.31 |
|
10 psig |
23.96 |
21.09 |
17.90 |
12.72 |
11.64 |
10.96 |
10.29 |
|
30 psig |
33.6 |
28.05 |
22.94 |
15.23 |
13.62 |
12.75 |
11.80 |
|
50 psig |
46.0 |
36.0 |
28.20 |
17.57 |
15.36 |
14.31 |
13.07 |
|
60 psig |
53.9 |
40.4 |
31.10 |
18.75 |
16.19 |
15.05 |
13.66 |
|
70 psig |
63.5 |
45.6 |
34.1 |
19.96 |
17.00 |
15.79 |
14.22 |
|
75 psig |
69.3 |
48.5 |
35.8 |
20.59 |
17.40 |
16.17 |
14.50 |
|
Source: Ref. 4. |
How many lb/h of superheated steam at 1000psia, 900°F, is required to generate 7500 kW in a steam turbine if the backpressure is 200psia and the overall efficiency of the turbine generator system is 70%?
Solution. From the steam tables, at 1000 psia, 900°F, h1 = 1448.2 Btu/lb and entropy = 1.6121 Btu/lb°F. At 200psia, corresponding to the same entropy, we must calculate h2s by interpolation. We can note that steam is in superheated condition. h2s = 1257.7 Btu/lb. Then
3413
ASR =——————————————- = 25.6 lb/kWh
0.70 X (1448 — 1257.7) ‘
Hence, to generate 7500 kW, the steam flow required is
Ws = 25.6 X 7500 = 192,000 lb/h
What is cogeneration? How does it improve the efficiency of the plant?
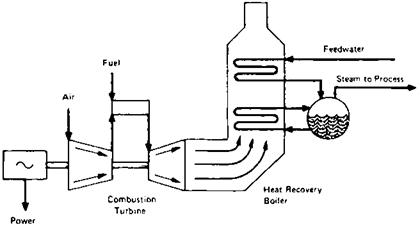
Cogeneration is the term used for simultaneous generation of power and process steam from a single full source, as in a system of gas turbine and process waste heat boiler, wherein the gas turbine generates electricity and the boiler generates steam for process (see Fig. 9.1).
In a typical power plant that operates at 35-43% overall efficiency, the steam pressure in the condenser is about 2-4in. Hg. A lot of energy is wasted in the cooling water, which condenses the steam in the condenser.
If, instead, the steam is generated at a high pressure and expanded in a steam turbine to the process steam pressure, we can use the steam for process, and electricity is also generated. A full credit for the process steam can be given if the steam is used—hence the improvement in overall energy utilization. Q9.02b explains this in detail.
50,0 lb/h of superheated steam at 1000 psia and 900°F is available in a process plant. One alternative is to expand this is a steam turbine to 200 psia and use the 200 psia steam for process (cogeneration). Another alternative is to expand the
|
|
Superheated steam in a steam turbine to 1 psia, generating electricity alone in a power plant. Evaluate each scheme.
Scheme 1. The steam conditions are as in Q9.01, so let us use the data on enthalpy. Assume that the turbine efficiency is 70%. The electricity produced can be written as follows using Eq. (1):
P = W-Z. x (3)
P is in kilowatts. h1 = 1448Btu/lb and h2s = 1257.7 Btu/lb, from Q 9.01. Substituting into Eq. (3), we have
P = 50,000 x (1448 — 1257.7) x -070 = 1954 kW
3413
Now let us calculate the final enthalpy at condition 2, h2. Using the equation
Zt(h1 — h2s) = h1 — h2 (4)
We obtain
0.70 x (1448 — 1257.7) = 1448 — h2
Or
This enthalpy is available for process in the cogeneration mode. The energy Q available in the cogeneration mode is the sum of the electricity produced and the energy to process, all in Btu/h. Hence the total energy is
Q = 1954 x 3413 + 50,000 x 1315 = 72.4 x 10⁶ Btu/h
Scheme 2. Let us take the case when electricity alone is generated. Let us calculate the final steam conditions at a pressure of 1 psia. s1 = 1.6121 = s2s. At 1psia, from the steam tables, at saturated conditions, Sf = 0.1326 and sg = 1.9782. Sf and sg are entropies of saturated liquid and vapor. Since the entropy s2s is in between Sf and sg, the steam at isentropic conditions is wet. Let us estimate the quality x. From basics,
0.1326(1 — x)+ 1.9782x = 1.6121
Hence
X = 0:80
The enthalpy corresponding to this condition is
H = (1 — x)hf + xhg
Or
H2s = 0.80 x 1106 + 0.2 x 70 = 900 Btu/lb
(hf and hg are 70 and 1106 at 1psia.) Using a turbine efficiency of 75%, from Eq. (3) we have
0:75
P = 50,000 x (1448 — 900) x = 6023 kW
= 20.55 x 10⁶ Btu/h
Hence we note that there is a lot of difference between the energy patterns of the two cases, with the cogeneration scheme using much more energy than that used in Scheme 2.
Even if the steam in Scheme 1 were used for oil heating, the latent heat of 834 Btu/lb at 200 psia could be used.
Total output = 1954 x 3413 + 50,000 x 834 = 48.3 x 10⁶ Btu/h
This is still more than the output in the case of power generation alone.
Note, however, that if the plant electricity requirement were more than 2000 kW, Scheme 1 should have more steam available, which means that a bigger boiler should be available. Evaluation of capital investment is necessary before a
Particular scheme is chosen. However, it is clear that in cogeneration the utilization of energy is better.
Which is a better location for tapping steam for deaeration in a cogeneration plant with an extraction turbine, the HRSG or the steam turbine?
When steam is taken for deaeration from the HRSG and not from an extraction point in a steam turbine, there is a net loss to the system power output because the steam is throttled and not expanded to the lower deaerator pressure. Throttling is a mere waste of energy, whereas steam generates power while it expands to a lower pressure. To illustrate, consider the following example.
An HRSG generates 80,000 lb/h of steam at 620psig and 650°F from
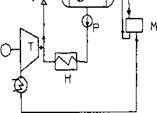
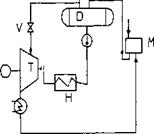
550,0 lb/h of turbine exhaust gases at 975°F. The steam is expanded in an extraction-condensing steam turbine. Figure 9.2 shows the two schemes. The
|
|
|
(Tor) |
|
□ — DEAERATOR M — MIXING TANK H — HRSG |
|
T-TURBINE |
|
P — PUMP V — VALVE |
|
Ft
FIGURE 9.2 Options for taking steam for deaeration. |
Condenser operates at 2.5in. Hg abs. The deaerator is at 10psig. Blowdown losses = 2%. Neglecting flash steam and vent flow, we can show that when steam is taken for deaeration from the HRSG,
81.700 x 208 = 1700 x 28 + (80,000 — X) x 76 + 1319X
Where 208, 28, 76, and 1319 are enthalpies of feedwater at 240°F, makeup water at 60°F, condensate at 108°F, and steam at 620psig, 650°F.
The deaeration steam X = 8741 lb/h; use 8785 to account for losses. Now compute the actual steam rate (ASR) in the steam turbine (see Q9.01). It can be shown that ASR = 11.14 lb/kWh at 70% expansion efficiency; hence power output of the turbine generator = 0.96 x (80,000 — 8785)/11.14 = 6137kW, assuming 4% loss in the generator.
81.700 x 208 = 1140.6X + (80,000 — X) x 76 + 1700 x 28
Hence X= 10,250 lb/h. Then ASR for expansion from 620 psig to 30psia = 19lb/kWh and 11.14 for the remaining flow. The power output is
„ /10,250 80,000 — 10,250
P = 096 x (“1^- +——————— ni4———- ) = 6528 kW
Thus a significant difference in power output can be seen. However, one has to review the cost of extraction machine versus the straight condensing type and associated piping, valves, etc.
A fan develops an 18 in. WC static head when the flow is 18,000 acfm and static efficiency of the fan is 75%. Determine the brake horsepower required, the horsepower consumed when the motor has an efficiency of 90%, and the annual cost of operation if electricity costs 5 cents/kWh and the annual period of operation is 7500 h.
The power required when the flow is q acfm and the head is Hw in. WC is
BHP = q Hw (5)
Q 6356zf
Where zf is the efficiency of the fan, fraction; in this case, zf = 0.75.
HP = — (6)
Zm
Where zm is the motor efficiency, fraction. Substituting the data, we have
18
BHP = 18,000 x———————- = 68 hp
0.75 x 6356 F
And
HP = — = 76 hp 0.9 F
The annual cost of operation will be
76 x 0.74 x 0.05 x 7500 = $21,261 (0.74 iS the conversion factor from hp to kW.)
A fan develops 18,000 acfm at 18 in. WC when the ambient conditions are 80°F and the elevation is 1000 ft (case 1). What are the flow and the head developed by the fan when the temperature is 60°F and the elevation is 5000 ft (case 2)?
The head developed by a fan would vary with density as follows:
(7)
Where p is the density, lb/cu ft, and the subscripts 1 and 2 refer to any two ambient conditions.
The flow q in acfm developed by a fan would remain the same for different ambient conditions; however, the flow in lb/h would vary as the density changes.
Let us use Table 9.2 for quick estimation of density as a function of elevation and temperature. p = 0.075/factor from Table 9.2. At 80°F and 1000 ft elevation,
Pj = 0 075 = 0.0707 lb/cu ft 1 1 . 06
At 60°F and 5000 ft,
P2 = °’°|75 = 0.0636 lb/cu ft
1.18
|
Temp. (°F) |
Altitude (ft) and barometric pressure (in. Hg) |
||||||||||||
|
2) 0 9.92 9 (2 |
500 (29.38) |
1000 (28.86) |
1500 (28.33) |
2000 (27.82) |
2500 (27.31) |
3000 (26.82) |
3500 (26.32) |
4000 (25.84) |
4500 (25.36) |
5000 (24.90) |
5500 (24.43) |
6000 (23.96) |
|
|
— 40 |
.79 |
.81 |
.82 |
.84 |
.85 |
.87 |
.88 |
.90 |
.92 |
.93 |
.95 |
.97 |
.99 |
|
0 |
.87 |
.88 |
.90 |
.92 |
.93 |
.95 |
.97 |
.99 |
1.00 |
1.02 |
1.04 |
1.06 |
1.08 |
|
40 |
.94 |
.96 |
.98 |
1.00 |
1.01 |
1.03 |
1.05 |
1.07 |
1.09 |
1.11 |
1.13 |
1.16 |
1.18 |
|
70 |
1.00 |
1.02 |
1.04 |
1.06 |
1.08 |
1.10 |
1.12 |
1.14 |
1.16 |
1.18 |
1.20 |
1.22 |
1.25 |
|
80 |
1.02 |
1.04 |
1.06 |
1.08 |
1.10 |
1.12 |
1.14 |
1.16 |
1.18 |
1.20 |
1.22 |
1.25 |
1.27 |
|
100 |
1.06 |
1.08 |
1.10 |
1.12 |
1.14 |
1.16 |
1.18 |
1.20 |
1.22 |
1.25 |
1.27 |
1.29 |
1.32 |
|
120 |
1.09 |
1.11 |
1.13 |
1.16 |
1.18 |
1.20 |
1.22 |
1.24 |
1.27 |
1.29 |
1.31 |
1.34 |
1.37 |
|
140 |
1.13 |
1.15 |
1.17 |
1.20 |
1.22 |
1.24 |
1.26 |
1.29 |
1.31 |
1.34 |
1.36 |
1.39 |
1.41 |
|
160 |
1.17 |
1.19 |
1.21 |
1.24 |
1.26 |
1.28 |
1.31 |
1.33 |
1.35 |
1.38 |
1.41 |
1.43 |
1.46 |
|
180 |
1.21 |
1.23 |
1.25 |
1.28 |
1.30 |
1.32 |
1.35 |
1.37 |
1.40 |
1.42 |
1.45 |
1.48 |
1.51 |
|
200 |
1.25 |
1.27 |
1.29 |
1.32 |
1.34 |
1.36 |
1.39 |
1.42 |
1.44 |
1.47 |
1.50 |
1.53 |
1.55 |
|
250 |
1.34 |
1.36 |
1.39 |
1.41 |
1.44 |
1.47 |
1.49 |
1.52 |
1.55 |
1.58 |
1.61 |
1.64 |
1.67 |
|
300 |
1.43 |
1.46 |
1.49 |
1.51 |
1.54 |
1.57 |
1.60 |
1.63 |
1.66 |
1.69 |
1.72 |
1.76 |
1.79 |
|
350 |
1.53 |
1.56 |
1.58 |
1.61 |
1.64 |
1.67 |
1.70 |
1.74 |
1.77 |
1.80 |
1.84 |
1.87 |
1.91 |
|
400 |
1.62 |
1.65 |
1.68 |
1.71 |
1.75 |
1.78 |
1.81 |
1.84 |
1.88 |
1.91 |
1.95 |
1.99 |
2.02 |
|
450 |
1.72 |
1.75 |
1.78 |
1.81 |
1.85 |
1.88 |
1.92 |
1.95 |
1.99 |
2.03 |
2.06 |
2.10 |
2.14 |
|
500 |
1.81 |
1.84 |
1.88 |
1.91 |
1.95 |
1.98 |
2.02 |
2.06 |
2.10 |
2.14 |
2.18 |
2.22 |
2.26 |
|
550 |
1.91 |
1.94 |
1.98 |
2.01 |
2.05 |
2.09 |
2.13 |
2.17 |
2.21 |
2.25 |
2.29 |
2.33 |
2.38 |
|
600 |
2.00 |
2.04 |
2.07 |
2.11 |
2.15 |
2.19 |
2.23 |
2.27 |
2.32 |
2.36 |
2.40 |
2.45 |
2.50 |
|
650 |
2.09 |
2.13 |
2.17 |
2.21 |
2.25 |
2.29 |
2.34 |
2.38 |
2.43 |
2.47 |
2.52 |
2.56 |
2.61 |
|
700 |
2.19 |
2.23 |
2.27 |
2.31 |
2.35 |
2.40 |
2.44 |
2.49 |
2.53 |
2.58 |
2.63 |
2.68 |
2.73 |
|
750 |
2.28 |
2.32 |
2.37 |
2.41 |
2.46 |
2.50 |
2.55 |
2.60 |
2.64 |
2.69 |
2.74 |
2.80 |
2.85 |
|
800 |
2.38 |
2.42 |
2.46 |
2.51 |
2.56 |
2.60 |
2.65 |
2.70 |
2.75 |
2.80 |
2.86 |
2.91 |
2.97 |
|
850 |
2.47 |
2.52 |
2.56 |
2.61 |
2.66 |
2.71 |
2.76 |
2.81 |
2.86 |
2.92 |
2.97 |
3.03 |
3.08 |
|
900 |
2.57 |
2.61 |
2.66 |
2.71 |
2.76 |
2.81 |
2.86 |
2.92 |
2.97 |
3.03 |
3.08 |
3.14 |
3.20 |
|
950 |
2.66 |
2.71 |
2.76 |
2.81 |
2.86 |
2.91 |
2.97 |
3.02 |
3.08 |
3.14 |
3.20 |
3.26 |
3.32 |
|
1000 |
2.76 |
2.81 |
2.86 |
2.91 |
2.96 |
3.02 |
3.07 |
3.13 |
3.19 |
3.25 |
3.31 |
3.37 |
3.44 |
18 _ Hw2
0.0707 0.0636
Hw2 = 16.1 in. WC
In case 1 flow will be
18.0 x 0.0707 x 60 = 76,356 lb/h and in case 2 the flow will be
18.0 x 0.0636 x 60 = 68,638 lb/h
Why should the capacity of forced draft fans for boilers be reviewed at the lowest density condition?
For the same heat input to boilers, the air quantity required in mass flow units (lb/h) remains the same irrespective of the ambient conditions.
W = 60pq
Where
W = mass flow, lb/h p = density, lb/cu ft q = volumetric flow, acfm
Fans discharge constant volumetric flow at any density. Hence if the fan is sized to give a particular volumetric flow at the high density condition, the mass flow would decrease when density decreases as can be seen in the equation above. Hence the fan must be sized to deliver the volumetric flow at the lowest density condition, in which case the output in lb/h will be higher at the higher density condition, which can be then controlled.
Also, the gas pressure drop AP in in. WC across the wind-box is proportional to W2/p. If the air density decreases as at high temperature conditions, the pressure drop increases, because W remains unchanged for a given heat input. Considering the fact that H/p is a constant for a given fan,
Where H is the static head in in. WC, using the lowest p ensures that the head available at higher density will be larger.
9.06b Q:
How does the horsepower of a forced draft fan for boilers or heaters change with density?
Equation (5) gives the fan horsepower:
BHP = ■ qHw
Using the relation W = 60qp, we can rewrite the above as
Bhp = —WH—
381,360 pZ/
For a boiler at a given duty, the air flow in lb/h and the head in in. WC, Hw, remain unchanged; hence as the density decreases, the horsepower increases. This is yet another reason to check the fan power at the lowest density condition. However, if the application involves an uncontrolled fan that delivers a given volume of air at all densities, then the horsepower should be evaluated at the highest density case because the mass flow would be higher as well as the gas pressure drop.
A triplex reciprocating pump is used for pumping 40 gpm (gallons per minute) of water at 100°F. The suction pressure is 4psig and the discharge pressure is 1000 psig. Determine the BHP required.
Use the expression
DP
BHP = q x —— (8)
Q = flow, gpm DP = differential pressure, psi Zp = pump efficiency, fraction
In the absence of data on pumps, use 0.9 for triplex and 0.92 for quintuplex pumps.
1000 — 4
BHP = 40 x——————— = 25.8 hp
1715 x 0.90 F
A 30 hp motor can be used.
The same expression can be used for centrifugal pumps. The efficiency can be obtained from the pump characteristic curve at the desired operating point.
9.08 Q:
A pump is required to develop 230 gpm of water at 60°F at a head of 970 ft. Its efficiency is 70%. There are two options for the drive: an electric motor with an efficiency of 90% or a steam turbine drive with a mechanical efficiency of 95%. Assume that the exhaust is used for process and not wasted.
If electricity costs 50 mills/kWh, steam for the turbine is generated in a boiler with an efficiency of 85% (HHV basis), and fuel costs $3/MM Btu (HHV basis), determine the annual cost of operation of each drive if the plant operates for 6000 h/year.
Another form of Eq. (8) is H
BHP = W x———————————————————————————- (9)
1,980,0 zp
Where
W = flow, lb/h
H = head developed by the pump, ft of liquid
For relating head in ft with differential pressure in psi or flow in lb/h with gpm, refer to Q5.01. Substituting into Eq. (9) and assuming that s = 1, W = 230 x 500 lb/h,
970
BHP = 230 x 500 x—————————— = 81 hp
0.70 x 1,980,000 F
The annual cost of operation with an electric motor drive will be
6000
81 x 0.746 x 0.05 x——— = $20,142
0.90
(0.746 is the conversion factor from hp to kW.)
If steam is used, the annual cost of operation will be
3
81 X 2545 X 6000 X 0.85 x 0.90 x 106 = $4595
(2545Btu/h = 1hp; 0.85 is the boiler efficiency; 0.95 is the mechanical efficiency.) Hence the savings in cost of operation is 20,142 — 4545 = $15,547/year.
Depending on the difference in investment between the two drives, payback can be worked out. In the calculation above it was assumed that the backpressure steam was used for process. If it was wasted, the economics may not work out the Same way.
How does the specific gravity or density of liquid pumped affect the BHP, flow, and head developed?
A pump always delivers the same flow in gpm (assuming that viscosity effects can be neglected) and head in feet of liquid at any temperature. However, due to changes in density, the flow in lb/h, pressure in psi, and BHP would change. A variation of Eq. (9) is
Bhp=^ = W AP d0)
1715Zp 857,000z_pS v ’
Where
Q = liquid flow, gpm W = liquid flow, lb/h s = specific gravity AP = pressure developed, psi H = head developed, ft of liquid
Also,
H = 2.31 — (11)
S
If a pump can develop 1000 gpm of water at 40°F through 1000 ft, what flow and head can it develop when the water is at 120°F? Assume that pump efficiency is 75% in both cases.
Solution. s1 at 40°F is 1 (from the steam tables; see the Appendix). s2 at
120°F is 0.988.
DP1 = 1000 x 2-31 = 433 psi From Eq. (11),
433
BHP, = 1000 x——————- = 337 hp
1 0.75 x 1715 F
W1 = SOOqjSj = 500 x 1000 x 1 = 500,000 lb/h At 120°F,
|
|
|
BHP2 = 1000 x |
|
AP2 = 1000 x |
W2 = 500 x 0.988 x 1000 = 494,000 lb/h If the same W is to be maintained, BHP must increase.
How does the temperature of water affect pump power consumption?
The answer can be obtained by analyzing the following equations for pump power consumption. One is based on flow in gpm and the other in lb /h.
|
|
|
Where |
![]() (12)
(12)
Q = flow, gpm H = head, ft of water s = specific gravity Zp = efficiency
In boilers, one would like to maintain a constant flow in lb/h, not in gpm, and at a particular pressure in psi. The relationships are
W A P
Q = -^ and H = 2.31 x —
500s s
Where
W = flow, lb/h AP = pump differential, psi
Substituting these terms into (1), we have
BHP = W——— AP——————————————————————— (13)
857,000zps v 7
A similar analogy can be drawn with fans in boiler plants, which require a certain amount of air in lb/h for combustion and a particular head in in. WC.
A centrifugal pump delivers 100 gpm at 155 ft of water with a 60 Hz supply. If the electric supply is changed to 50 Hz, how will the pump perform?
For variations in speed or impeller size, the following equation applies:
-=N=# (“)
Q2 N2 V H2
Where
Q = pump flow, gpm H = head developed, ft N = speed, rpm
Use of Eq. (14) gives us the head and the flow characteristics of a pump at different speeds. However, to get the actual operating point, one must plot the
New head versus flow curve and note the point of intersection of this curve with the system resistance curve. In the case above,
50
Q2 = 100 x — = 83 gpm
|
60
|
9.11
Q:
How does the performance of a pump change with the viscosity of the fluids pumped?
A:
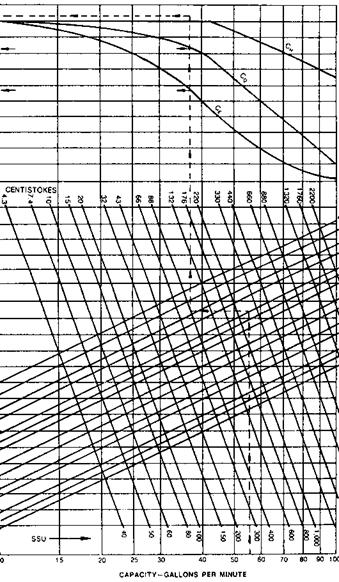
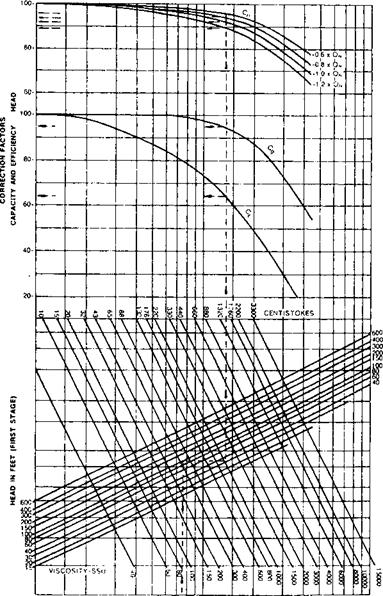
The Hydraulic Institute has published charts that give correction factors for head, flow, and efficiency for viscous fluids when the performance with water is known (see Figs. 9.3a anD 9.3b).
A pump delivers 750 gpm at 100 ft head when water is pumped. What is the performance when it pumps oil with viscosity 1000 SSU? Assume that efficiency with water is 82%.
Solution. In Fig. 9.3b, go up from capacity 750 gpm to cut the head line at 100 ft and move horizontally to cut viscosity at 1000 SSU; move up to cut the various correction factors.
CQ = 0.94, CH = 0.92, CE = 0.64
Hence the new data are
Q = 0.94 x 750 = 705 gpm
H = 0.92 x 100 = 92 ft
Zp = 0.64 x 92 = 52%
The new H versus q data can be plotted for various flows to obtain the characteristic curve. The operating point can be obtained by noting the point of intersection of the system resistance curve with the H versus q curve. Cq, Ch, and CE are correction factors for flow, head, and efficiency.
|
|
RE 9.3a Viscosity corrections. (Courtesy of Hydraulic Institute/< ial.)
|
J $ 6 10 15 20 40 60 SO *00 CAPACITY IN IM GPM FIGURE 9.3b Determination of pump performance when handling viscous liquids. (Courtesy of Hydraulic Institute/Gould Pump Manual.) |
What is the temperature rise of water when a pump delivers 100 gpm at 1000 ft at an efficiency of 60%?
The temperature rise of fluids through the pump is an important factor in pump maintenance and performance considerations and must be limited. The recirculation valve is used to ensure that the desired flow goes through the pump at low load conditions of the plant, thus cooling it.
From energy balance, the friction losses are equated to the energy absorbed by the fluid.
2545
AT = (BHP — theoretical power) x (15a)
WCP
Where
AT = temperature rise of the fluid, ° F BHP = brake horsepower W = flow of the fluid, lb/h Cp = specific heat of the fluid, Btu/lb °F
For water, Cp = 1.
From Eq. (9),
BHP = " H
Zp x 3600 x 550
Where zp is the pump efficiency, fraction. Substituting into Eqs. (15a) and (9) and simplifying, we have
1/Zp — 1
TOC o "1-5" h z AT = H x——————————————————————————— (15b)
778 v 7
If H = 100 ft of water and zp = 0.6, then
1.66 — 1
AT = 1000 x————— « 1°F
778
How is the minimum recirculation flow through a centrifugal pump determined?
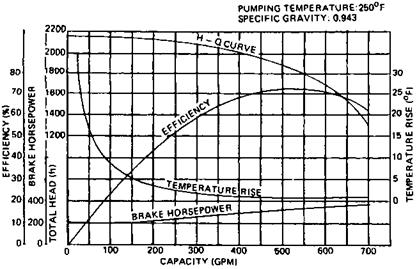
Let us illustrate this with the case of a pump whose characteristics are as shown in Fig. 9.4. We need to plot the AT versus Q characteristics first. Note that at low flows when the efficiency is low, we can expect a large temperature rise. At 100 gpm, for example,
Zp = 0.23 and H = 2150 ft
Then
1/0.23 — 1
AT = 2150 x —————- = 9°F
778
In a similar fashion, AT is estimated at various flows. Note that AT is higher at low flows owing to the low efficiency and also because of the lesser cooling capacity.
The maximum temperature rise is generally limited to about 20°F, depending on the recommendations of the pump manufacturer. This means that at least 40 gpm must be circulated through the pump in this case. If the load is only 30 gpm, then depending on the recirculation control logic, 10-70 gpm could be recirculated through the pump.
|
FIGURE 9.4 Typical characteristic curve of a multistage pump also showing temperature rise versus capacity. |
What is net positive suction head (NPSH), and how is it calculated?
|
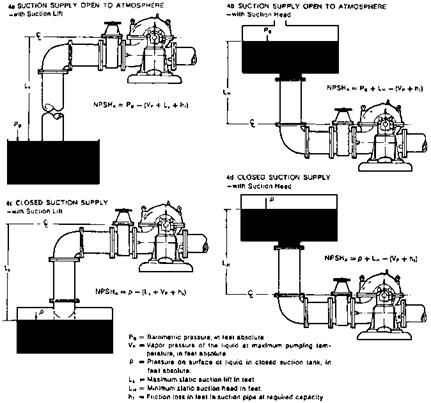
FIGURE 9.5 Calculation of system NPSH available for typical suction conditions. |
NPSHr (NPSH required) is the positive head in feet absolute required to overcome the pressure drop due to fluid flow from the pump suction to the eye of the impeller and maintain the liquid above its vapor pressure. NPSHr varies with pump speed and capacity. Pump suppliers generally provide this information. NPSHa can be determined by a gauge reading at pump suction:
NPSHa =PB — VP ±PG + VH (16)
Where
VH = velocity head at the gauge connection, ft
PG = pressure gauge reading, converted to ft
VP = vapor pressure, ft absolute
PB = barometric pressure, ft (if suction is atmospheric)
To avoid cavitation, NPSHa must be greater than NPSHr.
9.15
Q:
Does the pump suction pressure change NPSHa?
A:
NPSHa is given by
NPSHa = Ps + H — VP — H (17)
Where
Ps = suction pressure, ft of liquid H = head of liquid, ft
VP = vapor pressure of the liquid at operating temperature, ft Hf = friction loss in the suction line, ft
For saturated liquids, VP « Ps, so changes in suction pressure do not significantly change NPSHa.
Determine the NPSHa for the system shown in Fig. 9.5b when H =10 ft, H = 3 ft, and VP = 0.4 psia (from the steam tables). Assume that the water has a density of 62lb/cu ft.
Solution.
144
VP = 0.4 x — = 0.93 ft 62
Suction presssure = 14.6 psia = 14.6 x = 33.9 ft
NPSHa = 33.9 — 3 — 0.93 + 10 = 40 ft
9.16 Q:
In the absence of information from the pump supplier, can we estimate NPSHr? A:
A good estimate of NPSHr can be made from the expression for specific speed S.
S = N x—(18) NPSH
R
S ranges from 7000 to 12,000 for water.
For example, when q = 100 gpm, N = 1770, and assuming that S = 10,000 for water,
/ p001’33 NPSHr = 1770 X feW = 2.2ft
Even if we took a conservative value of 7000 for S, we would get NPSHr = 3.43 ft
This information can be used in making preliminary layouts for systems involving pumps.
How is NPSHa for a reciprocating pump arrived at?
NPSHa for a reciprocating pump is calculated in the same way as for a centrifugal pump except that the acceleration head Ha is included with the friction losses. This is the head required to accelerate the liquid column on each suction stroke so
That there will be no separation of this column in the pump suction line or in the pump [1]:
-NVC, N
Ha = (19)
Kg
Where
— = length of the suction line, ft (actual length, not developed)
V = velocity in the suction line, ft/s N = pump speed, rpm
C is a constant: 0.066 for triplex pump, 0.04 for quintuplex, and 0.2 for duplex pumps. K is a factor: 2.5 for hot oil, 2.0 for most hydrocarbons, 1.5 for water, and 1.4 for deaerated water. g = 32 ft/s2. Pulsation dampeners are used to reduce — significantly. By proper selection, — can be reduced to nearly zero.
A triplex pump running at 360 rpm and displacing 36 gpm has a 3 in. suction line
8 ft long and a 2 in. line 18 ft long. Estimate the acceleration head required.
So/wft’on. First obtain the velocity of water in each part of the line. In the
3 in. line, which has an inner diameter of 3.068 in.,
V = 0.41 = 0.41 x —36 2 = 1.57 ft/s
D2 (3.068)2
In the 2 in. line, which has an inner diameter of 2.067 in.,
V = 0.41 x —= 3.45 ft/s
(2.067)2
The acceleration head in the 3 in. line is
0.066
Ha = 8 x 360 x 1.57 x ——— = 6.7 ft a 1.4 x 32
In the 2 in. line,
0.066
Ha = 18 x 3.45 x 360 x ——— = 32.9 ft a 1.4 x 32
The total acceleration head is 32.9 + 6.7 = 39.6 ft.
9.18
Q:
How can we check the performance of a pump from the motor data?
A good estimate of the efficiency of a pump or a fan can be obtained from the current reading if we make a few reasonable assumptions. The efficiency of a motor is more predictable than that of a pump owing to its small variations with duty. The pump differential pressure and flow can be obtained rather easily and accurately. By relating the power consumed by the pump with that delivered by the motor, the following can be derived. The pump power consumption, P, in kW from Eq. (8) is
DP
TOC o "1-5" h z P = 0.00043q x — (20)
Zp
Motor power output = 0.001732EI cos f zm (21)
Equating Eqs. (20) and (21) and simplifying, we have
QDP = 4EI cos f ZpZm (22)
where
Q = flow, gpm DP = differential pressure, psi E = voltage, V I = current, A Zp, Zm = efficiency of pump and motor, fraction cos f = power factor
From Eq. (22) we can solve for pump efficiency given the other variables. Alternatively, we can solve for the flow by making a reasonable estimate of zp and check whether the flow reading is good. The power factor cos f typically varies between 0.8 and 0.9, and the motor efficiency between 0.90 and 0.95.
A plant engineer observes that at a 90 gpm flow of water and 1000 psi differential, the motor current is 100 A. Assuming that the voltage is 460 V, the power factor is
0. 85, and the motor efficiency is 0.90, estimate the pump efficiency.
Solution. Substituting the data into Eq. (22), we obtain
90 x 1000 = 4 x 460 x 100 x 0.85 x 0.90 x zp
Solving for zp, we have zp = 0.65.
We can use this figure to check whether something is wrong with the system. For instance, if the pump has been operating at this flow for some time but the current drawn is more, one can infer that the machine needs attention. One can also check the pump efficiency from its characteristic curve and compare the calculated and predicted efficiencies.
Derive an expression similar to (22) relating fan and motor.
Equating the power consumption of a fan with that delivered by its motor,
P = 1.17 x 10⁻⁴ x qHw = 0.001732E1 cos f (23)
Where
Q = flow, acfm Hw = static head oF fAn, in. WC
Other terms are as in Q9.18.
If the efficiency of a fan is assumed to be 65% when its differential head is
4 in. WC, the motor voltage is 460, and the current is 7 A, then the power factor is
0. 8 and the motor efficiency is 85%. Solving for q, we have
1.17 x 10⁻⁴ x q x 4 = 0.001732 x 460 x 7 x 0.80 x 0.85 x 0.65
Or
Q = 5267 acfm
One can check from the fan curve whether the flow is reasonable. Alternatively, if the flow is known, one can check the head from Eq. (23) and compare it with the measured value. If the measured head is lower, for example, we can infer that something is wrong with the fan or its drive or that the flow measured is not correct.
How is the performance of pumps in series and in parallel evaluated?
For parallel operation of two or more pumps, the combined performance curve (H versus q) is obtained by adding horizontally the capacities of the same heads. For series operation, the combined performance curve is obtained by adding vertically the heads at the same capacities.
The operating point is the intersection of the combined performance curve with the system resistance curve. Figure 9.6 explains this. Head and flow are shown as percentages [2]. ABC is the H versus q curve for a single pump, DEF is the H versus q curve for two such pumps in series, and AGH is the H versus q curve for two such pumps in parallel. To obtain the curve DEF, we add the heads at a given flow For example, at q = 100%, H with one pump is 100%, and with two pumps H will be 200%. Similarly, AGH is obtained by adding flows at a given head. At H = 100, q for two pumps will be 200%.
Let the system resistance curve be KBGE. When one pump alone operates, the operating point is B. With two pumps in series, E is the operating point. With two pumps in parallel, G is the operating point.
BHP curves also have been plotted and reveal that with series operation BHP = 250% and with pumps in parallel BHP = 164%, indicating that BHP/q is larger in series operation than in parallel. This varies with pump and system resistance characteristics. NPSHr also increases with pump capacity.
|
FIGURE 9.6 Series and parallel operations of pumps with flat head capacity curves. (From Ref. 2.) |
BHP at G is 142%, whereas at B it is 100% (see the inset of Fig. 9.6). Hence in sizing drives for pumps in parallel, this fact must be taken into account. It is a good idea to check on whether the pump has an adequately sized drive.
A similar procedure can be adopted for determining the performance of fans in series and in parallel and for sizing drives.
9.21 Q:
Determine the parameters affecting the efficiency of the Brayton cycle [3].
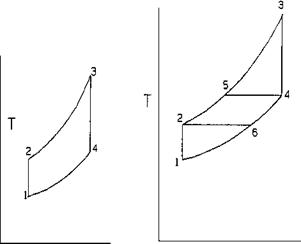
Figure 9.7a shows a simple reversible Brayton cycle used in gas turbine plants. Air is taken at a temperature 7 Absolute and compressed, and the temperature after compression is T2. Heat is added in the combustor, raising the gas temperature to T3; the hot gases expand to T4 in the turbine, performing work. Following are some of the terms used to describe the performance.
Thermal efficiency TE = Qa Qr (24)
|
|
|
Qa = heat added to cycle, Btu/lb
Qr = heat rejected, Btu/lb
TOC o "1-5" h z Qa = Cp (T3 — T2) (25)
Qr = Cp(T4 — Ti) (26)
P2 = P3 and Pj = P4 (27)
Also,
T2 = T3 = r(k-1)=k (28)
T1 T4
Where
PP
R = pressure ratio = — = — (29)
P1 P4
k = ratio of gas specific heats Cp = gas specific heat, Btu/lb T1 — T4 = temperatures, ° R P1 — P4 = pressure, psia
Using the above, we can write
TE = 1 — Q = 1 — T4 — T1 Qa T3 — T2
TOC o "1-5" h z = 1 — T1 x T4/T1 — 1 (30a)
T2 T3/T2 — 1 V ‘
Since, from Eq. (28), T4/Tj = T3/T2, we have
TE = 1 — — = 1 — 1 /r(k—1)/k (30b)
T2
A simple cycle takes in air at 80°F and 14.7 psia and compresses it at constant entropy through a pressure ratio of 4. The combustor raises the gas temperature to 1500°F. The heated air expands to 14.7psia at constant entropy in the turbine. Assume k = 1.3 and Cp = 0.28. Find (1) compression work, Wc; (2) heat input to cycle, Qa; (3) expansion work, Qe; (4) thermal efficiency, TE.
Solution. From Eq. (28),
T2 = (80 + 460) x 4(1-3-1)/1-3 = 742°R Note that 4(1-3-1)/1-3 = 1.375. Hence
Wc = Cp x (T2 — T1) = 0.28 x (742 — 540)
= 56.6 Btu/lb
Heat input to cycle = Qa
= Cp x (T3 — T2)
= 0.28 x (1500 + 460 -742)
= 341 Btu/lb
T4 = —^ = -1960 = 1425°R
4 1.375 1.375
Expansion work Qe = 0.28 x (1960 — 1425) = 150 Btu/lb
150 — 56.6
TE =—— ——— = 0.273, or 27.3%
341
Using Eq. (30b), TE = 1 — 1/1.375 = 0.273.
It can be seen that as the pressure ratio increases, TE increases. Also, as inlet air temperature decreases, the efficiency increases. That is why some gas turbine suppliers install chillers or air coolers at the compressor inlet so that during summer months the turbine output does not fall off compared to the winter months.
How can the efficiency of a simple Brayton cycle be improved?
One of the ways of improving the cycle efficiency is to use the energy in the exhaust gases (Fig. 9.7b) to preheat the air entering the combustor. This is called regeneration.
Assuming 100% regeneration, the exhaust gas at temperature T4 preheats air from T2 to T5 while cooling it to T6. The actual heat rejected corresponds to a temperature drop of T6 — T1, while the heat added corresponds to T3 — T5, and hence the cycle is more efficient. Assuming constant Cp,
TE = 1 — — = 1 — T6 — T Qa T3 — T5
H _ _ r(k—1)/^ _ Zk = ^3
T1 T1 T4 T5
TE = 1 — T1 Ts/T1 — 1
1 T5 (T3 / T5 — 1)
= 1 — Tl (T6/T1 = T3/T5; from above)
T5
Zi = Zi x Zl = Zi x r(k—1)/k
T5 T3 T5 T3
Hence
TE = 1 — — x r(k-1)/k (31)
3
Using the same data as above, compute the following for the ideal regenerative cycle: (1) Work of compression, Wc; (2) heat added to cycle; (3) heat added to regenerator; (4) expansion work in turbine; (5) cycle efficiency.
So/wft’on. For the same inlet temperature and pressure ratio, Wc = 56.6 and T2 = 742°R. Exhaust temperature from above = 1425°R = T5.
Heat added in regenerator = Cp x (T5 — T2)
= 0.28
X (1425 — 742) = 191.3 Btu/lb Heat added in combustor = Qa = Cp x (T3 — T5)
= 0.28 x (1960 — 1425)
= 150 Btu/lb Heat rejected = Qr = Cp x (T6 — T1)
= 0.28 x (742 — 540) = 56.6 Btu/lb
TE = 1 — Q = 1 — — = 0.622, or 62.2%
Qa 150 ’
Using (31)
TE = 1 — -540 x 4(1’3—1)/1’3 = 0.621, or 62.1%
1960
It is interesting to note that as the pressure ratio increases, the efficiency
Decreases. As the combustor temperature increases, the efficiency increases.
However, it can be shown that the power output increases with increases in the
Pressure ratio. Hence industrial gas turbines operate at a pressure ratio between 9 and 18 and an inlet gas temperature of 1800-2200°F.
ASR Actual steam rate, lb/kWh
BHP Brake horsepower, hp
Cq, Ch, CE Factors correcting viscosity effects for flow, head, and efficiency
Cp Specific heat, Btu/lb °F
D Tube or pipe diameter, in.; subscript i stands for inner diameter
E Voltage
H Enthalpy, Btu/lb; subscripts f and g stand for saturated liquid and
Vapor
H Head developed by pump, ft; subscript a stands for acceleration
HP Horsepower
Hw Head developed by fan, in. WC
I Current, A
K Ratio of gas specific heats, Cp/Cv
L Length, ft
N Speed of pump or fan, rpm
NPSH Net positive suction head, ft; subscripts a and r stand for available
And required P Power, kW
DP Differential pressure, psi
Q Flow, gpm or acfm
Qa, Qr Heat added, rejected, Btu/lb
R Pressure ratio
S Specific gravity
Sf, sg Entropy of saturated liquid and vapor, Btu/lb °R
S Specific speed
AT Temperature rise, °F
TE Thermal efficiency
T Temperature, °R
TSR Theoretical steam rate, lb/kWh
V Velocity, ft/s
W Flow, lb/h
Wc Work of compression, Btu/lb
Z Efficiency, fraction; subscripts f m, p, and t stand for fan, motor,
Pump, and turbine p Density, lb/cu
[1]Q8.36 refers to the Q and A section in Chapter 8. This nomenclature will be used throughout.
[2] 2 ln(2/1.773)
= 0.0782 + 0.001 + 0.0011 + 0.000565 + 0.0004 = 0.0813
Source: Fintube Technologies, Tulsa, OK.
[5] Increase the thermal conductivity of the fin material. This may be difficult, because the thermal conductivity of carbon steels is higher than that of alloy steels, and carbon steels can withstand temperatures only up to 850°F, whereas alloy steels can withstand up to 1300°F depending on the alloy composition.


 13 августа, 2013
  doctype

 Опубликовано в рубрике